Actual Resolution Tests
I thought I should also back up my discussion of image resolution with some actual tests. Although I have been involved with photography for close to sixty years and tested many lenses, I have never owned a "resolution chart": a chart with the black and white bar patterns used in standard tests to measure resolving power. I have always preferred to photograph real scenes and examine them for what can and cannot be identified in the image. This results in a very subjective process that helps me to understand my photographs, but it is not very open for others to understand and verify my observations. I figured that really won't suffice for my purposes here.
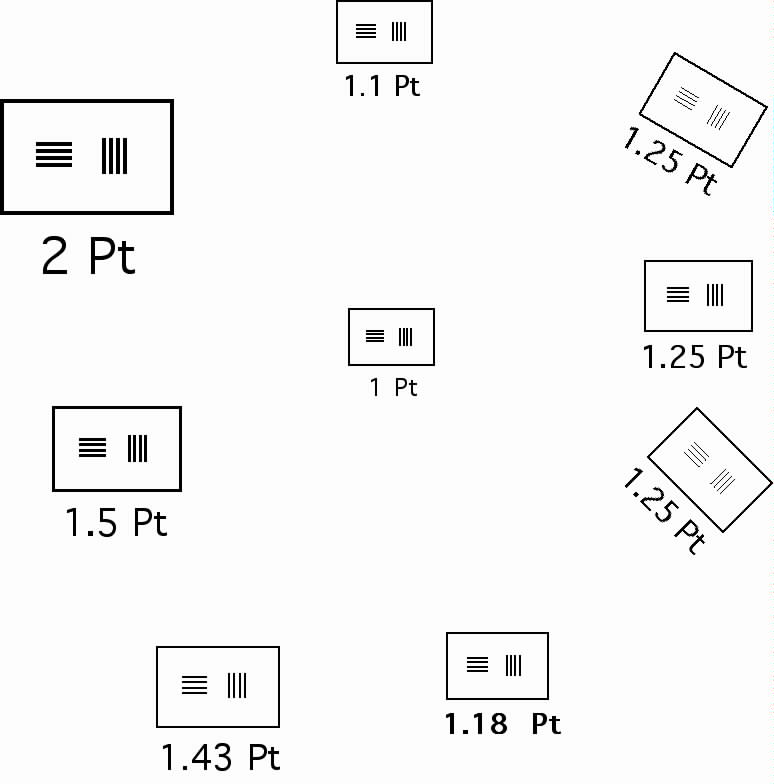
My first task, then, was to obtain some sort of resolution chart. I used an old Mac drawing program, Canvas 3.5, to create my own chart. The chart I eventually settled on is shown here.
(The chart is distorted by the down-scaling. A PDF version is available here.) Actual on-sensor resolutions corresponding to the targets above are: Top Row - 50 lines/mm (2 Pt), 90 lines/mm (1.1 Pt), 80 lines/mm (1.25 Pt). Center Row - 67 lines/mm (1.5 Pt), 100 lines/mm (1 Pt), 80 lines/mm. Bottom Row - 70 lines/mm (1.43 Pt), 85 lines/mm (1.18 Pt), and 80 lines/mm.
The "X.Y Pt" labels indicate the intended widths of the black lines and the width of the spaces between them. These widths are measured in "points" because that is what Canvas uses when drawing lines. One point is one seventy-second of an inch. You'll notice that I used four black bars in the pattern even though this does not correspond with anyone's standard. It also ignores the fact that my numerical calculations were based on only two bars. I believe two bars are not enough for testing purposes, even if it is the easiest case to analyse mathematically. It is important to use a small, easily counted number, and I picked four. My chart, printed on a laser printer, also showed minor anomalies because the Canvas pixel grid and the laser printer's pixel grid did not correspond with one another. There's also an issue in that Canvas draws the lines with a square "brush" and thus lines other than vertical and horizontal come out with the wrong width. I tried to compensate a best I could. End result: my chart is not perfect, but it is what I used.
The camera I used was a Canon 50D which has its pixels on a rectangular grid with a "pitch" of about 212 pixels per millimeter. I tried three lenses: a Canon 100/2.8 Macro, a Canon 50/1.2L, and a (cheap) Canon 50/1.8II. The one I ended up using is the 50/1.8. The 100 mm lens put my camera and flash too far away to be able to use ISO 200 for all f-stops; I had to boost the ISO setting for apertures smaller than about f/12. It was the only lens, however, that closed down to f/32. The main fault of the 50/1.2L was that it would not close down beyond f/16. This left the 50/1.8 that would close down to f/22 and which seemed to perform admirably.
The terms "lines per millimeter" and "line-pairs per millimeter" are confusing. They are the same thing; there is no factor of two involved here. When testers talk about "lines per millimeter" they are counting only the black lines. When they talk about "line-pairs", they define a pair as consisting of one black line and one white line.
The reason for using test targets with a small number of lines in the pattern is that one can easily encounter "spurious resolution": we can clearly see lines, but there are only three of them instead of four, for example. The miscount tells us that this is not a valid observation of resolution. We have to be able to see the right number of lines. Hence they should be easily counted. My reason for not believing that using only two lines is inappropriate is that it would be just too easy to see just one line due to spurious resolution, and then split that line using an over-zealous sharpening process, thus getting the right number of lines. With four lines, spurious resolution can (and did sometimes in my tests) yield three lines. Then splitting those would yield six lines clearly too many.
The camera was positioned 11 feet 7 inches from the target in order to make the finest resolution at the sensor 100 lines (or line pairs, if you prefer) per millimeter. Actually I initially just eyeballed the distance and got it wrong by 6 inches, so for my early tests it was actually 95 lines per millimeter. But I later measured and corrected the set-up I also did a few tests at the 50D's actual Nyquist frequency of 106 lines per millimeter. Tests at 120 lines/mm, not surprisingly, yielded no data. I did just see barely resolved bars at 106 lines/mm. This surprised me; I did not expect to see resolution at the Nyquist frequency. The lens was focused using live view with magnification at maximum, and using a magnifier to examine the rear screen of the camera. I normally focused at f/4. (Most lenses exhibit focus shift on stopping down, a result of residual spherical aberration.)
In the early tests I did see resolution at 95 lines/mm sometimes. It was never witnessed in in-camera JPEG images, but it sometimes appeared in processed RAW files. I eventually realized that the problem was that the camera pixel grid was aligned with the test-target bars, and, the camera sensors are not point sensors: they have finite size. These two factors mean that much of the time the camera's pixels will straddle the black/white edges of the bars and this drastically reduces contrast. Eventually, I tried putting the chart at about a 30 degree angle with respect to the camera. This improved the consistency of observations considerably.
I don't intend to list or illustrate all the results. Rather, I will try to summarize my observations.
Even after tilting the chart, I never observed resolutions above 80 lines per millimeter with in-camera JPEG images, no matter the lens aperture or what I tried in terms of sharpening etc.. On the other hand, I could frequently resolve the 95 lines/mm target in RAW files processed in Camera Raw 5. Initially I simply used the settings I normally use. With these setting I could resolve 95 lines/mm most of the time at any aperture from f/4 to f/10. After modifying my settings in Camera Raw, I could still see resolved bars at f/14. After I corrected the camera-to-target distance to get a true 100 lines/mm, f/13 was the limit. There were occasional exposures and camera-target angles where resolution was not observed. On the basis of these observations, I would state that the 50D can resolve 100 lines/mm sometimes, and even 106 lines/mm on the odd occasion. But one cannot say the 50D will always resolve even 85 lines/mm, although it almost always will. One can rely on the camera's ability to resolve 80 lines/mm.
Here's the central portion of the test chart for the 50 mm lens at f/13. "1 Pt" ia 100 lines/mm; "1.1 Pt" is 90 lines/mm. At 100 lines/mm the left part of the target shows a central white space that is too wide. This is in part valid, as the central white space did print too wide on my laser printer.
In-camera JPEG images seemed to work almost as well as RAW images at resolutions of about 70 lines/mm and below.
Recall that the diffraction limit can be expressed in the form:
R = Q/N
Where R is the resolution in lines/mm, Q is some number between about 800 and 1600, and N is the lens f-number. My results tended to support two values for Q. Using the level of sharpening I usually use, the appropriate number was about 1100, although lower if the resolution was approaching the camera's sensor limit. Using the settings that maximized resolution, the number was about 1400. In this case the optimal Camera Raw settings varied from case to case. It has been my past experience that the sharpening process that works best with some regular images, is to "sharpen less, but sharpen more often". And this technique seemed to work here also. If I used what seemed to be the best settings in Camera Raw, opened the image in Photoshop and then sharpened once or twice again using very weak sharpening settings, things improved further. As shown below, I could resolve 70 lines/mm at f/20, and that gives us Q=1400, almost the most optimistic estimate of the diffraction limit. But that's not quite the whole story.
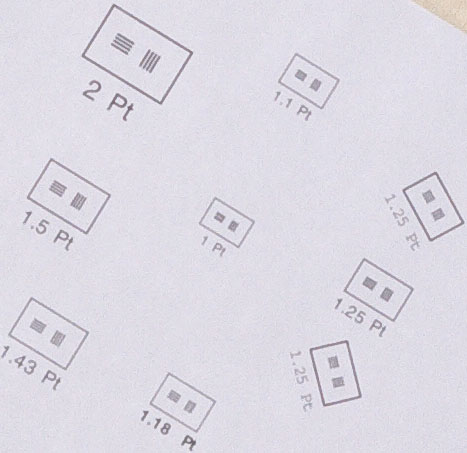
Here is the central portion of the camera image at f/20. You will see that 70 lines/mm (1.43 Pt) and lower, all bars are clearly resolved. For higher frequency targets there are lots of examples of spurious resolution. This image was recorded in RAW format and then opened in Adobe Camera Raw using sharpening parameters that optimized resolution (Amount: 100, Radius: 0.5, Detail: 50, Masking: 0, Luminance: 4, Color: 4).
In my article describing the Canon 50D as setting a new landmark in digital SLR resolution, I said the camera was diffraction limited at f/7.6. I certainly have to revisit that statement. A better number might be f/10 using RAW files and standard sharpening values. I don't remember where I got the initial number, or how it was justified. It does turn out to be about the right number if the requirement is for the camera plus diffraction-limited lens system to yield at least 90% of the performance of the sensor alone.
The formula usually proposed for estimating lens-film system resolution is:
(1/Rs)2 = (1/Rl)2 + (1/Rf)2
where Rs is the system resolution, Rl is the lens resolution and Rf is the film resolution. If the lens is diffraction limited at f/16, it should resolve 100 lines per millimeter. The 50D sensor can resolve 106 lines per millimeter. The system, then, should resolve about 72.7 lines per millimeter. This yields a Q or resolution-times-f-number of 1163. I could easily see 70 lines/mm even at f/20: Q = 1400. I also suggest that optimizing sharpening parameters can give us the equivalent of about an apparent one-stop improvement in resolution performance. All in all, I am left with the impression that digital imaging is already performing at or a little beyond the classical diffraction limit. It's either that or the formula for calculating the combined resolution of lens and imager is pessimistic for digital sensors. This encourages me to believe that a proper spatial filter designed to sharpen optimally will provide real gains in recovery from diffraction degradation in digital images.
In summary, this investigation delivered a few surprises, at least
for me. It also helped to clarify some issues associated with diffraction
degradation and "the resolution limit". As might be gathered from
my resolution chart, I did not really expect to see resolutions above about
85 lines/mm: 80 lines/mm was obviously the main initial target for my investigation.
At higher resolutions I was surprised in two ways. I was surprised to see
clear resolution at 100 lines/mm at all, and to see it at f/13 was an even
bigger surprise. At the same time, I was surprised by the random nature
of observations at the higher resolutions: sometimes you see it and sometimes
you don't. It is clearly possible, but one cannot rely on obtaining it 100%
of the time. This phenomenon has a rational explanation, but it was still
a surprise. I was also surprised by just how "good" the Canon
50D is. I saw very few imaging artifacts: moiré, colour fringes etc.
(I see such effects more often in the course of every-day photography.)
And the 50/1.8 lens performed just as I would have expected an "ideal
lens" to perform. (I didn't use it at apertures larger than f/4, however.)
The investigation has also changed my view of "the Rayleigh resolution
limit". For several decades I have regarded it as an arbitrary, if
approximately correct, rule of thumb. I now see it as a valid tool for telling
us what we need to do in terms of contrast, noise levels etc. in order to
achieve a specified level of resolution. It is not a hard limit; we can
move it if we know how! Whether or not super-resolution lenses can or cannot
be manufactured is still very much of an open question, at least for me.
I continue to believe such lenses are possible. I no longer regard higher-than-standard
resolutions as something exceptional. Achievable resolution is a simple
consequence of the state of our lens and image processing technology. There
is a "law of diminishing returns": it gets more and more difficult
to push the limits higher, but it is always possible to make improvements.
I have known for decades that apodization should make lenses better. I think
it should be a routine aspect of professional-level imaging. Why are we
not doing it already? I have not had the opportunity to test apodized lenses,
but it certainly appears to me that the benefits should easily be worth
the cost. There's little question that there are issues in manufacturing
such lenses economically, (and they won't soon have "automatic diaphragms")
but they ought to be affordable. Using such lenses should not pose significant
difficulties in many photographic applicationa. Even if we don't use apodized
lenses for the express purpose of improving resolution, it is still worth
doing in terms of image contrast and bokeh.
References
Arthur Cox, Photographic Optics, 15th Edition, Focal Press, London & New York, 1974.
Back to Resolution Intro
Back to Concerning Photographic Resolution
Back to Super-Resolution - Or Not
Go to Ray Maxwell's original Essay: Brick Wall Ahead:...
Go to to Nathan Myhrvold's Not So Fast in Dismissing Moore's Law
Back to the Rebuttles collection on The Luminous Landscape.
Return to The Luminous Landscape What's New page.
Return to HMbooks Table of Contents.